From improving profits to managing staff flows, or balancing investment risk, most problems are just
plain complicated, many things depend on each other, there can be long delays between actions and
outcomes, and different parts of the situation may be managed by different people, and so on. So
it’s no surprise it can be hard to know what’s best to do – and spreadsheets, tables and charts are
little help because we can’t see what’s causing what.
Luckily, there’s a way to help. You’ve probably seen pictures of
control panels people use to manage rail or power networks, oil refineries and so on.
These work because you can see how pieces are connected, what state key parts of the system are
in, and how the things you push and pull are linked into the system you control.
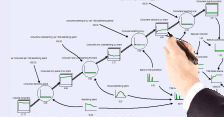
That’s what our diagrams and models do for any type of organisation – whether for-profit, not-for-profit,
government and so on. How complicated the picture or model needs to be depends on the size and complexity
of the issues you need to tackle. You can often get great understanding from simple, small pictures – we have
cracked some pretty big issues on a table napkin! Just an accurate diagram of what causes what,
with a few key numbers explaining how things are changing.
 You can go much further if you need to – bigger diagrams with more numbers on a white-board for
bigger issues, working simulation models to test alternatives, living 'control panels' that give
you and your team way more mastery over performance than balanced scorecards ever can. And it
all works because the underlying principles capture rigorously key features of how the real
world works.
Want to know more? Take a look under the "Approach" heading on the site menu.